Data Clarity with Looker Studio Templates
Whether you’re managing marketing campaigns, analyzing business data, or tracking performance, these templates make it easy to turn raw numbers into actionable insights. Built with simplicity and flexibility in mind, they’re ready to use and easy to customize for your specific needs.
How it works?


GA4 Comprehensive Dashboard for NGOs
This dashboard is free to use and easy to integrate with your data.
Need help setting it up? Book a setup call
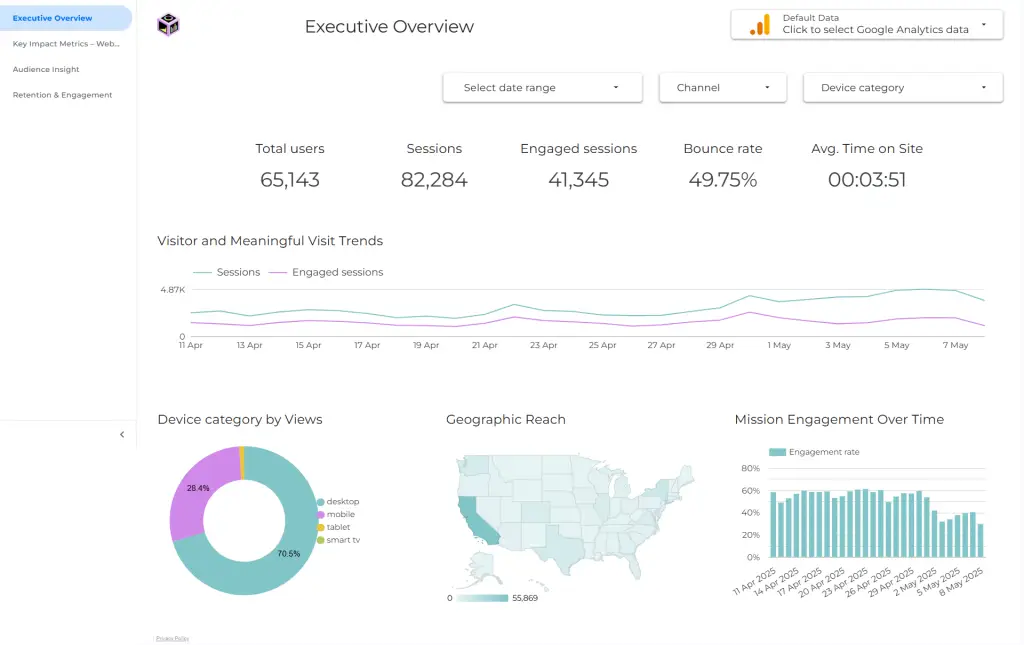
This dashboard provides a comprehensive view of your website’s performance, helping you understand how visitors engage with your mission and where your impact is strongest.
- Executive Overview: Monitor total users, sessions, engagement, and bounce rate at a glance, with trends by device and region to assess your site’s overall impact.
- Key Impact Metrics – Website Activity: Identify your most visited pages and landing pages, track how visitors engage, and uncover potential drop-off points based on exit rates and device behavior.
- Audience Insight: Explore who’s interacting with your mission by age, gender, and device, and evaluate which traffic sources and campaigns drive the highest value.
- Retention & Engagement: Track user loyalty over time with active users across 1-, 7-, and 28-day windows, and understand how often visitors return and engage with your site.
Youtube Analytics Dashboard
This dashboard is free to use and easy to integrate with your data.
Need help setting it up? Book a setup call
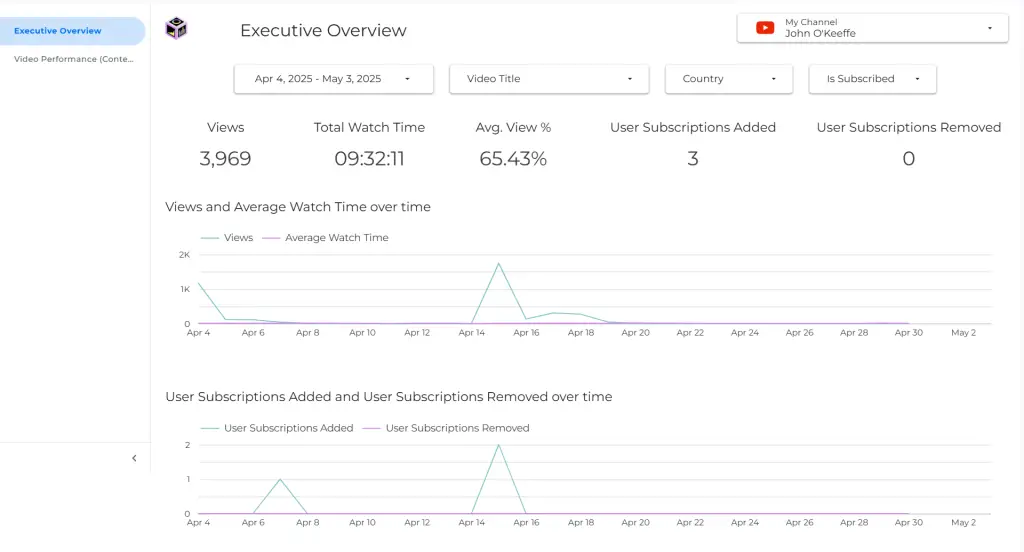
This dashboard provides a comprehensive view of your video content performance on YouTube, helping us understand what resonates most with viewers and how our content contributes to audience growth.
Channel Overview: Monitor total views, watch time, average view percentage, and subscriber changes, with engagement trends over time.
Video-Level Performance: Compare individual videos by views, average watch time, likes, comments, and shares, with visualizations of view duration vs. volume and daily view trends by title.
Multi-Channel Google Ads Dashboard
This dashboard is free to use and easy to integrate with your data.
Need help setting it up? Book a setup call
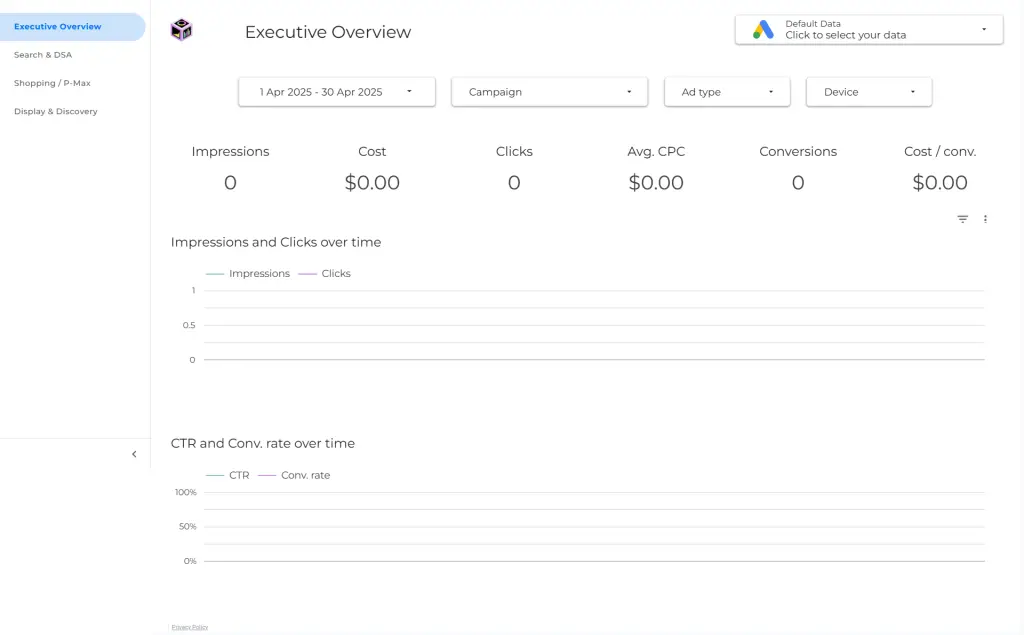
This interactive Looker Studio dashboard offers a comprehensive view of your Google Ads performance across Search, Shopping, Display, and Performance Max campaigns. Designed for marketing teams and media buyers, it includes:
Executive Overview: Monitor key ad metrics like cost, impressions, clicks, conversions, CPC, and ROAS, with trend visualizations over time.
Search Campaigns: Dive into keyword-driven performance, including CTR, conversion rate, and cost-per-conversion by campaign, ad type, and device.
Shopping & P-Max: Evaluate product-based campaigns with insights into spend efficiency, conversion value, and ROAS at both campaign and item level.
Display & Discovery: Track visual ad performance across formats like responsive display and image ads, with audience breakdowns and engagement trends.
Audience Performance: Analyze which audience segments are driving results across channels, helping you refine targeting and improve return on ad spend.
GA4 B2C E-Commerce Dashboard
This dashboard is free to use and easy to integrate with your data.
Need help setting it up? Book a setup call
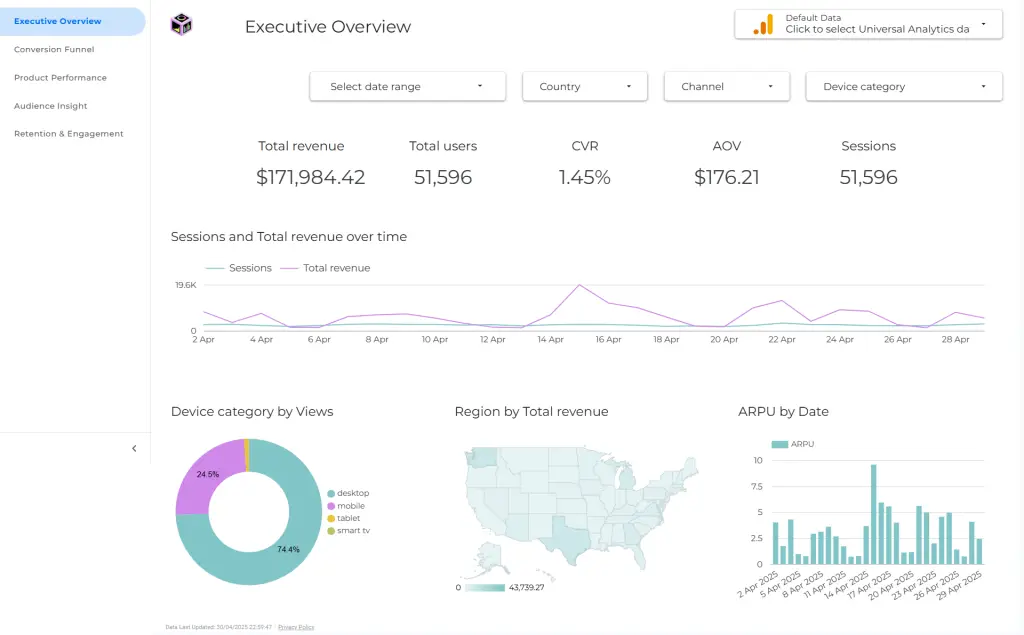
This interactive Looker Studio dashboard provides a complete overview of your GA4 e-commerce performance, tailored for direct-to-consumer (DTC) brands. Key sections include:
Executive Overview: Track total revenue, user sessions, conversion rates, and AOV at a glance, alongside trends by device and region.
Conversion Funnel: Visualize the full buyer journey from session start to purchase, including CTR, basket-to-view %, and first-time buyer rate.
Product Performance: Analyze item-level performance including impressions, views, cart adds, checkouts, and purchases, with revenue breakdowns by category.
Audience Insights: Understand revenue by age, gender, and acquisition source, with insights into session duration and conversion by channel.
Retention & Engagement: Monitor active users over 1, 7, and 28-day windows, engaged sessions, and event frequency to assess user loyalty and app stickiness.


